Billing Dashboard
Learn about the billing dashboard on the Datastreamer platform.
What is the Billing Dashboard?
The Billing Dashboard is part of Portal that shows you a wealth of information on your usage and costs for your Dynamic Pipelines in the Platform. It has the following sections:
- Cost Explorer
- Account Tier
- Month Forecast
- Insights
Cost Explorer
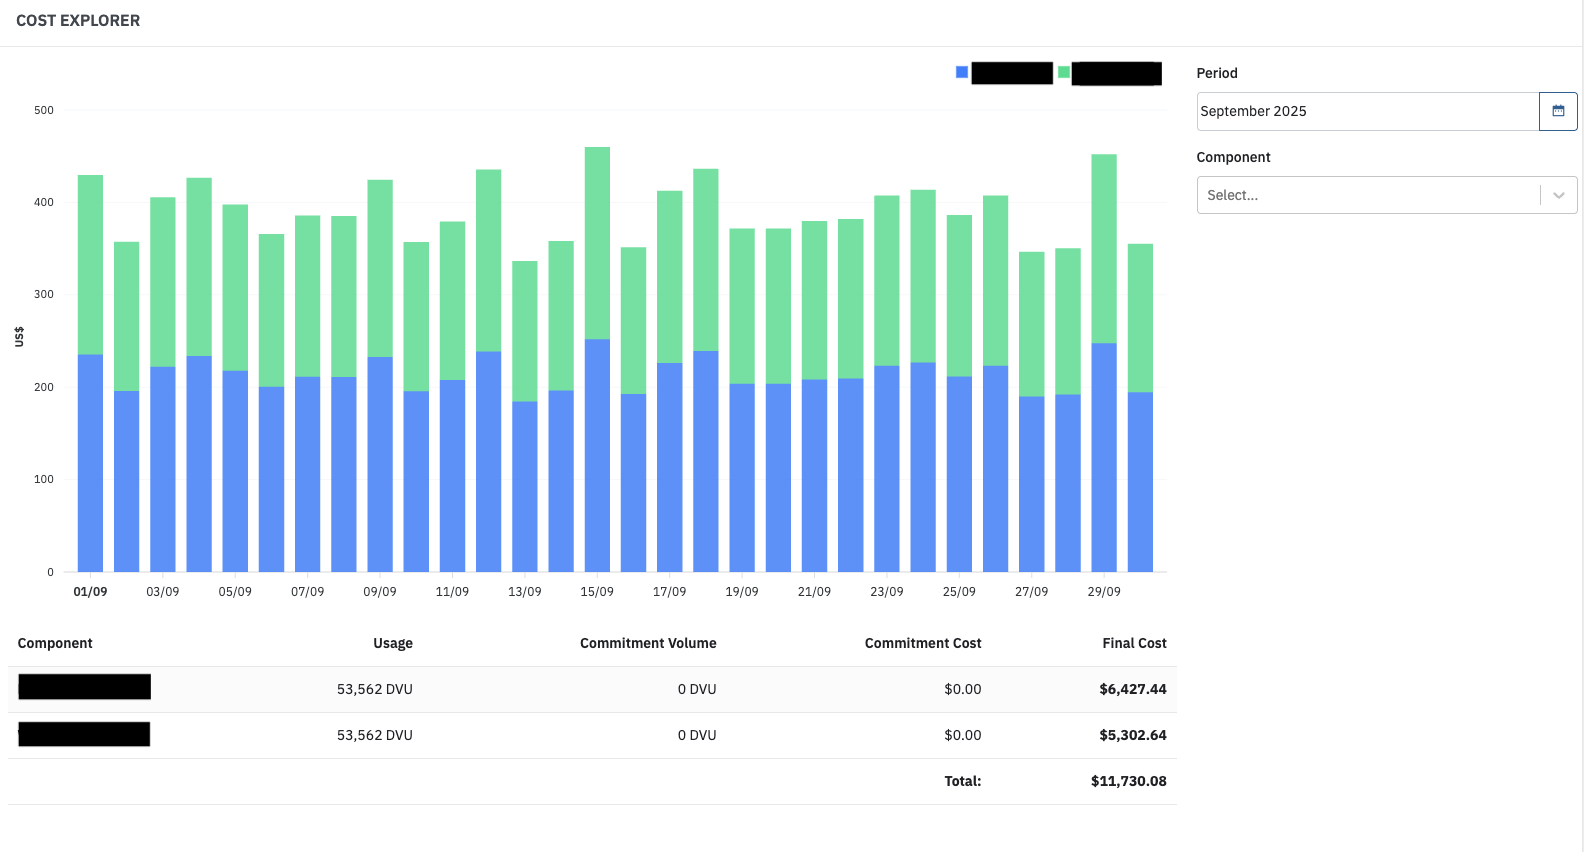
The Cost Explorer provides a visual graph of the month, and allows you to explore the costs historically, and drill into specific components. The graph shows the spend per day of the entire organization account, and combines the usage of each component across all pipelines.
The table below the graph shows the component, usage during period, commit volume, commit cost, and the final cost. You can use the drop downs on the right to look at specific components or other months. By default the current month will be shown.
In addition, you can select the specific areas of the graph to filter to any component.
Components that are part of a bundle will be listed as a bundle and not as individual components. For more information on Component Bundles, see here: More Info

Example of a usage dashboard. Sources redacted.
Account Tier & Commitments Panel
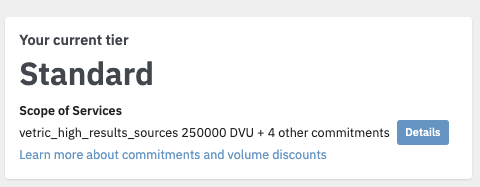
The Account Tier and Commitment box will show your current account status, as well as the scope of services that you have committed to.

Sample Information Box
Selecting "Details" will open the Scope of Service screen that contains a log of all commitments requested and applied.

Sample Score of Service
The Scope of Services is a change log of any commits and changes. In addition, it also contains the date and person who has requested the changes.
Month Forecast Panel
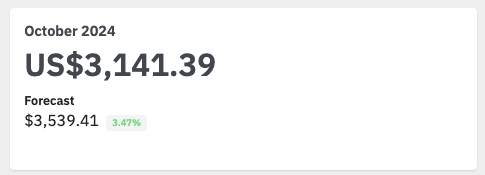
The Month Forecast information box shows the current usage in the active month, as well as a forecast based on usage. This forecast takes into account active commits, as well as variability of usage in a day.

Insights Panel
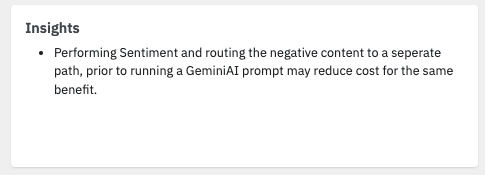
The Insights information box allows the Field Product team to documents insights relevant to the users of the billing dashboard. Insights are generally focused on optimization of spend and usage.

Updated 2 months ago
