
Pipeline Metrics & Analytics
Understanding and viewing metrics associated with a Pipeline.
Overall Platform Metrics
Billing and usage information is visible on Daily and Monthly levels on the Billing page of Portal. These metrics are filterable to specific components being used across multiple Pipelines. For Pipeline-specific information and metrics, Component Cards give detailed information.
Understanding Component Cards
Component Cards update with usage metrics every 10 seconds to give a live view of the performance of components within a Datastreamer Pipeline. These Component Cards describe the information of that specific component within the Pipeline. These metrics reset upon deployment of a new version or Stopping of a pipeline.
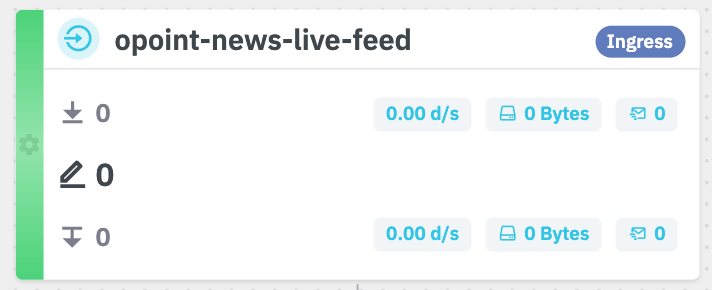
A Sample Component Card that is healthy but has not processed any content.
Component Card Overview
On the Component Card is the name of the component, any associated tags, and also a color-coded status. The Components can be grey, green, yellow, or red.
- ⬜️ Grey: This Component has not been configured.
- 🟩 Green: This Component is healthy.
- 🟨 Yellow: This Component is adapting to a surge of content, recoverable issues, or experiencing a backlog of content to process. Components in a Yellow state are dynamically adapting to the situation and should revert to green shortly.
- 🟥 Red: This Component is unhealthy. It may have met a failure condition, or other non-recoverable issues. The Datastreamer team is notified if any Pipeline enters a red state and begin addressing.
Metrics on the Component Cards
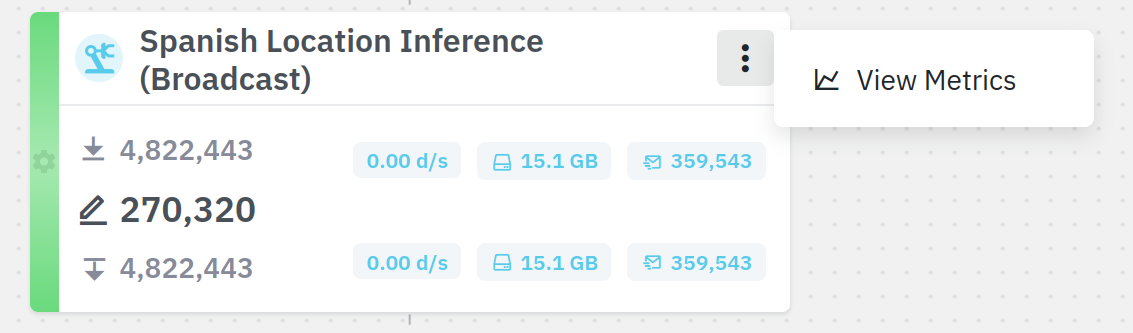
There are a number of metrics visible on a Component card. These update every 10 seconds. The metrics can be read as three rows, and right-to-left.
- Received: These metrics surround information entering the component. The information displayed is: total of documents received, rate of documents received per second, total size of documents received, and total count of messages received. A single message may contain multiple documents.
- Processed: Total count of documents processed.
- Sent: Similar to Received, these metrics surround content being sent from the component. The information displayed is: total of documents sent, rate of documents sent per second, total size of documents sent, and total count of messages sent. A single message may contain multiple documents.
The metrics between total count of documents (and other metrics) may be different from received to processing to sent, especially if the Component has integrated filtering elements. Some components (like a Splitter) may send more documents than ingested, while other Components (like a Lucene filter) may have Sent metrics much lower then received or processed.
Metrics Sidebar
Each component in the platform provides a Metrics Sidebar for real-time monitoring and historical analysis. This sidebar can be accessed by clicking the context menu (⋮) on the top-right corner of any component card, except while in edit mode.
It allows you to query diverse metrics types for the past 7 days, the options available are:
- Documents received
- Documents processed
- Documents forwarded to other components
- Bytes received
- Bytes forwarded to other components
- Document batches waiting to retry
- Batches received
- Batches forwarded to other components
Besides those main metric types, some components might have other metrics specific to their cases.
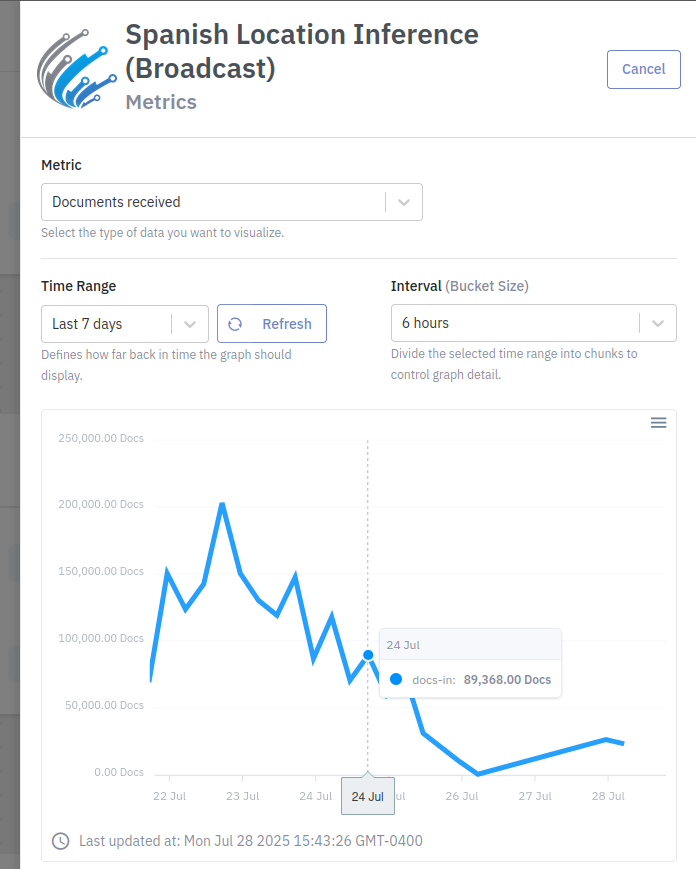
The Interval (Bucket Size) selector allows you to choose the granularity of your request.
Updated about 1 month ago