
Component Log Viewer
Built-in panel that lets you inspect every execution log produced by an individual component in your pipeline
The Component Log Viewer is a built-in panel inside the Datastreamer Pipeline page that lets you inspect the execution log produced by an individual component in your pipeline. It is available only when your pipeline is running (deployed) on Datastreamer.
Not all components are supportedNot all components support the log viewer. If the View Logs option is missing, the selected step does not expose its logs to the portal.
Accessing the viewer
- Open any deployed pipeline.
- Click in the three dots icon (
⋮) in the step. - Choose View Logs from the context menu.
- The viewer slides up from the bottom of the screen.
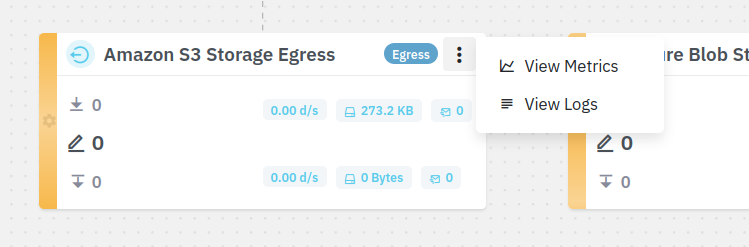
Accessing the View Logs feature
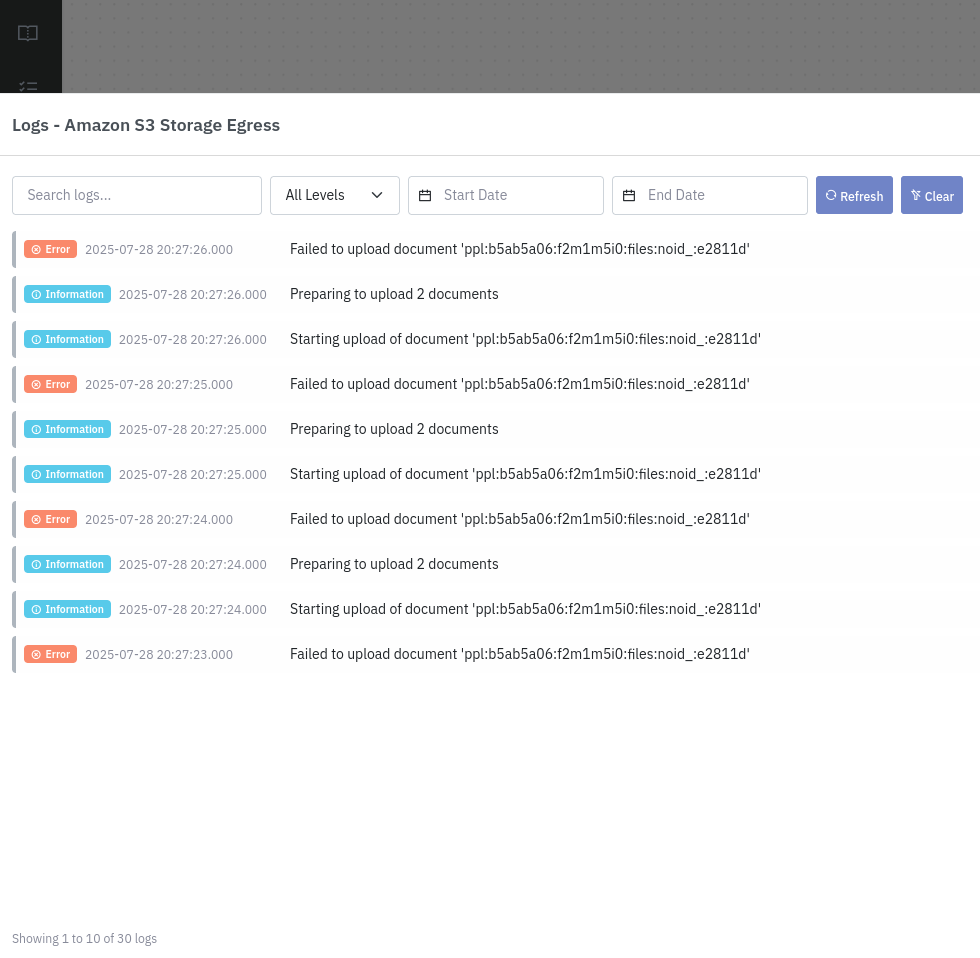
Component Log Viewer displaying logs
Filtering options
- Keyword: Free-text that matches anywhere in the message.
- Level: All Levels (default), Information, Warning, or Error.
- Date range: UTC date-time pickers. Only logs whose timestamp falls inside the range are returned.
- Refresh: Re-executes the query with current filters.
Log retention
Logs are retained for 3 days. If your date range is older, the viewer will show a notice instead of entries.
Typical workflow
- Notice a step is red or yellow in the graph.
- Click in the three dots icon (
⋮) in the step of the pipeline and open the View Logs. - Set Level = Error to see only failures.
- Use keyword search (e.g., “timeout”) to narrow down.
- Expand stack traces to understand the root cause.
- Fix your code or configuration and rerun the pipeline.
Updated about 1 month ago
Did this page help you?