
Pipeline Document Inspector Component
The Inspector UI allows you to test and observe the pipeline by providing the ability to fetch documents directly in the browser.
Getting Started
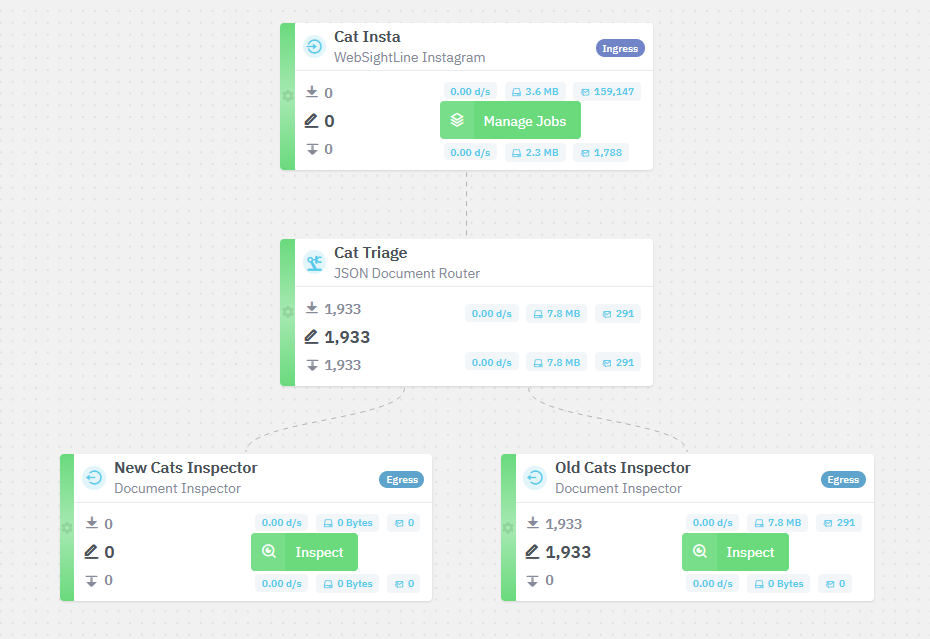
To begin, add a Document Inspector Egress component at any point in the pipeline where you want to fetch documents.
The Inspector maintains two separate caches:
- Main cache: Stores up to 1,000 documents total, including both job-related and non-job documents. This is what you see when no job filter is selected.
- Per-job cache: Stores up to 50 documents for each individual job. Older documents are trimmed as new ones arrive.
Documents in the main cache are retained for up to 7 days. Per-job caches expire after 2 hours.
Once added, new features will be available in the pipeline after deployment.
“Standalone” Inspector
When you click Inspect on a deployed Document Inspector Egress, a panel will display the most recent documents processed by that component.
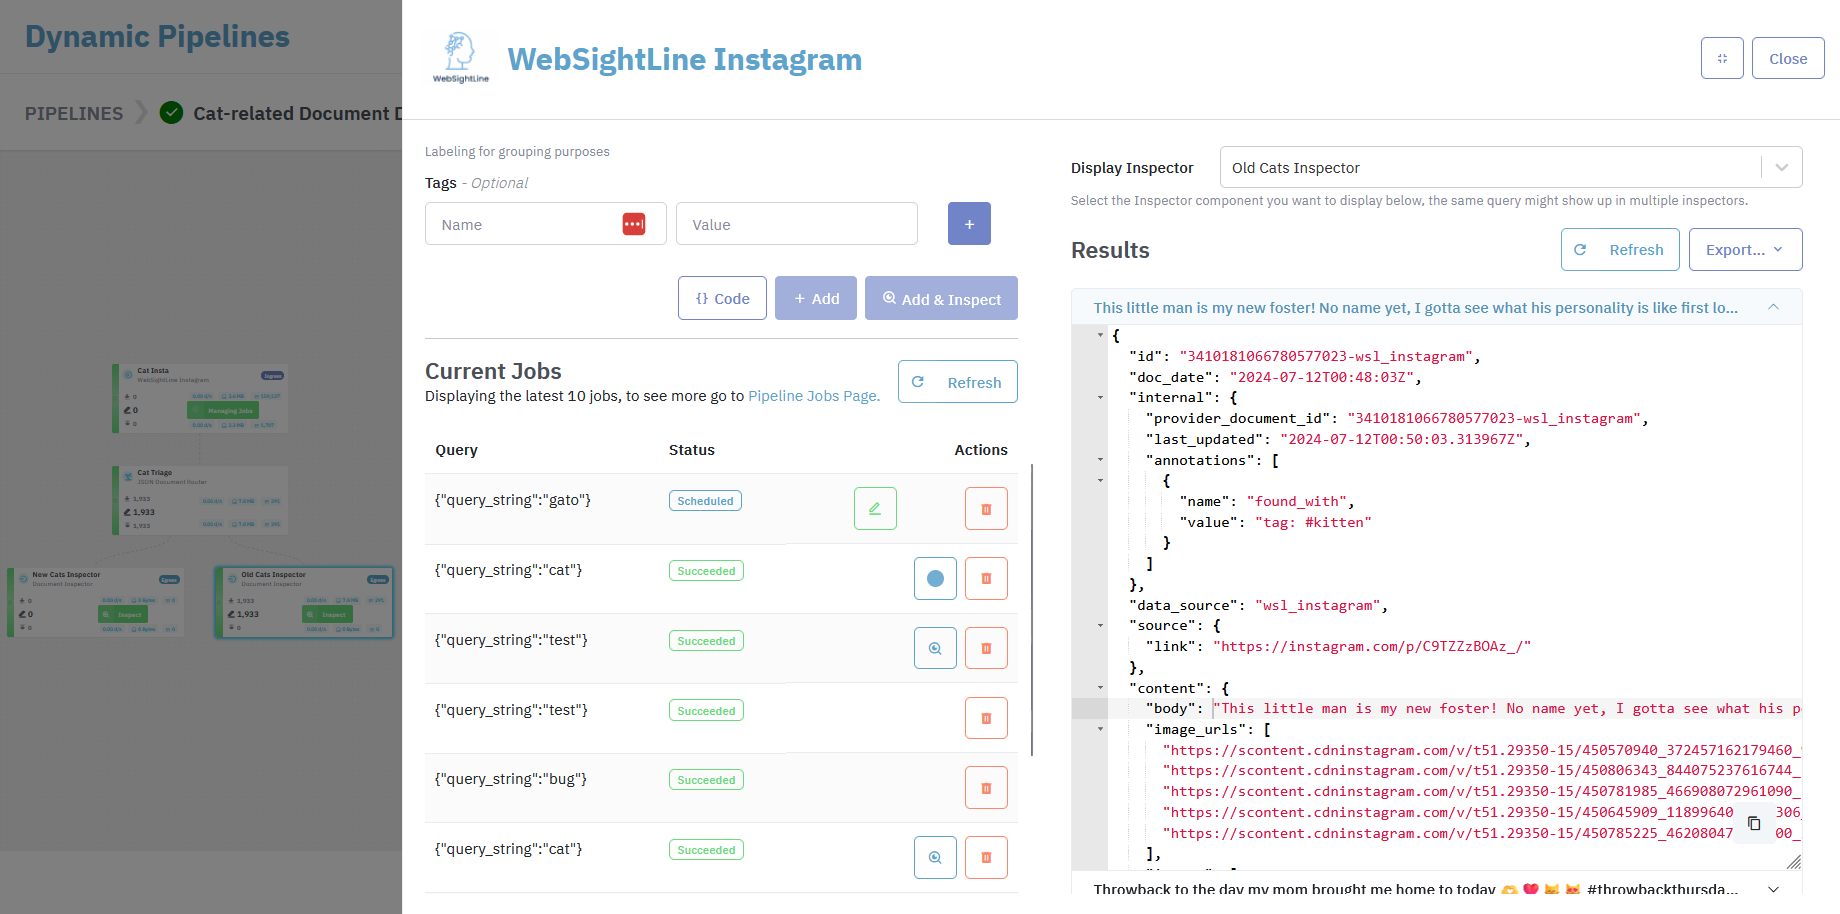
From this panel, you can expand a document to view its full JSON content. The title of each document in the list is dynamic and will change based on available fields. The current fallback priority is as follows:
document.content.bodydocument.doc_datedocument.id- Stringified JSON
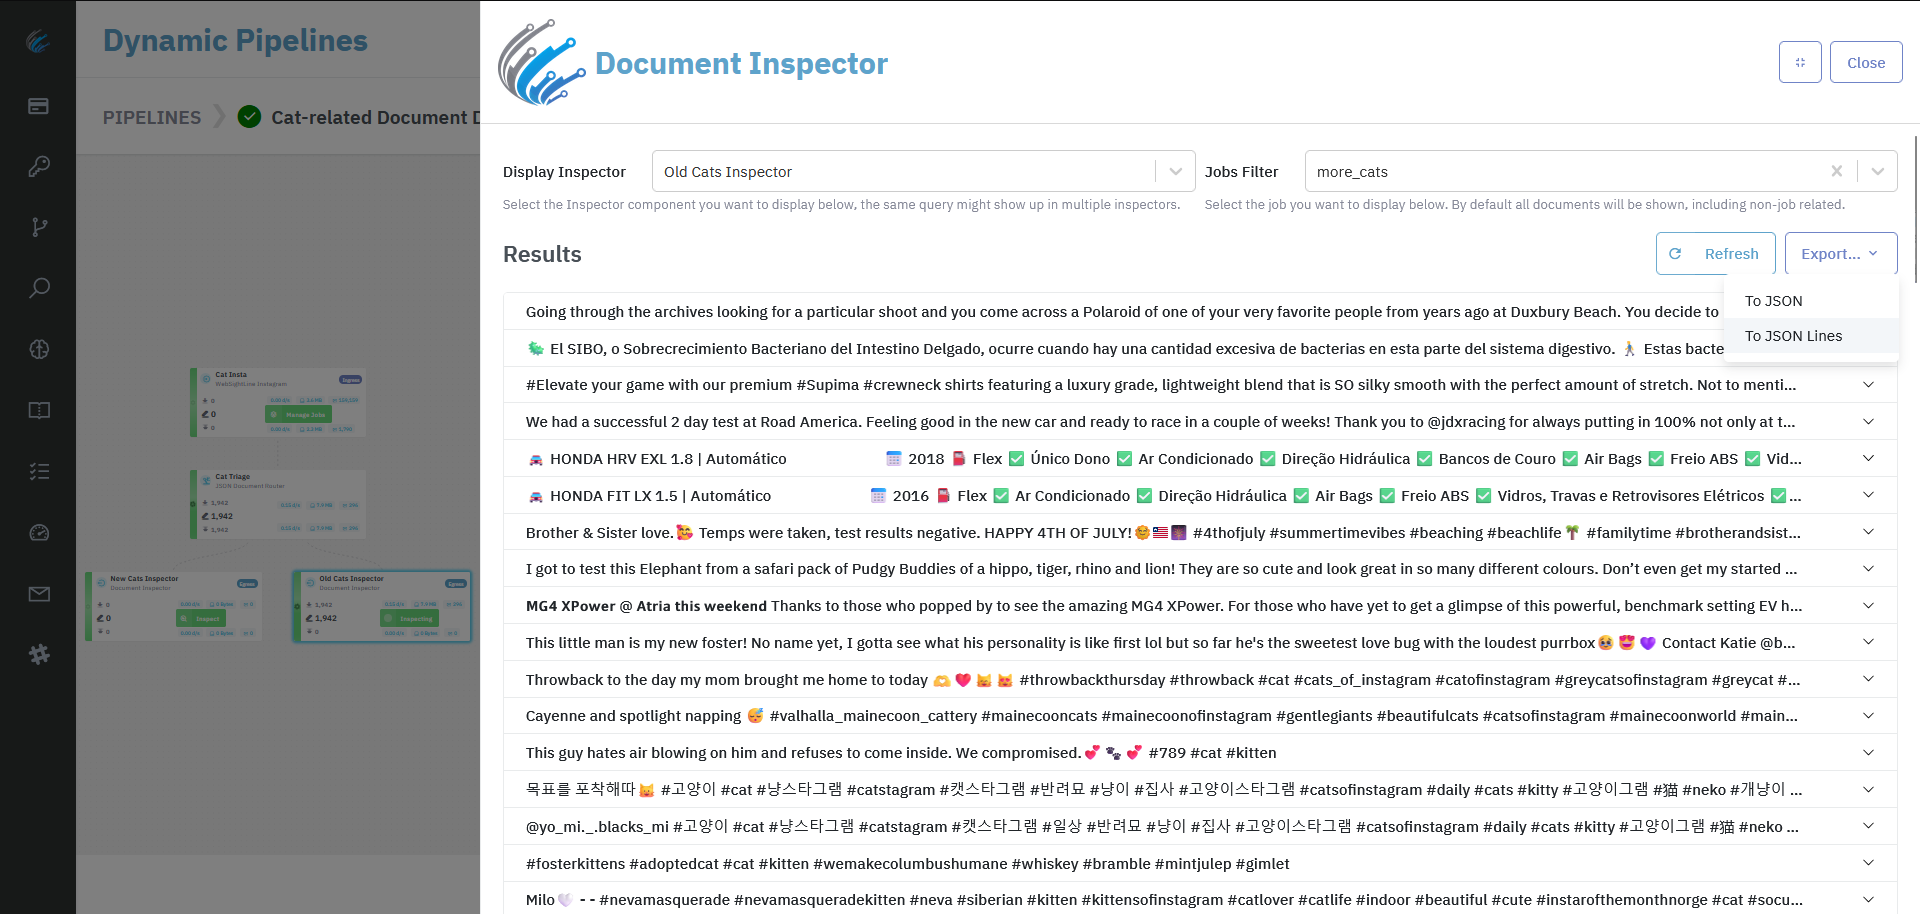
If your pipeline has more than one Inspector, a Display Inspector selector will be available, allowing you to quickly switch between different Inspectors.
If the Inspector identifies documents with job labels, a Job Filter will be available, enabling you to select and view documents related to a specific job. When a job is selected, the Inspector displays documents from both the main cache and the per-job cache, giving you the most complete view of that job's documents. Up to 50 documents are loaded initially — use Load More to see additional documents.
The Jobs Filter appears automatically once documents with job labels have been received by the Inspector. If no jobs have been detected yet, the filter will not be visible.
Clear Cache ButtonThe Clear Cache button will remove all documents stored in the Inspector component itself, this will not affect documents in other stages of the pipeline.
To export the documents currently visible in the UI, you can choose between JSON and JSON Lines formats.
The Inspector loads 100 documents at a time. You can load additional documents by clicking Load More at the bottom of the list.
Job System Inspector
In components that handle jobs, if any Inspector in the current pipeline has documents related to previous jobs, a Looking Glass button will be available. Clicking this button will take you to a shared Inspector page, pre-configured to display documents from the selected job.
On this shared page, all the features from the Standalone Inspector will be available.
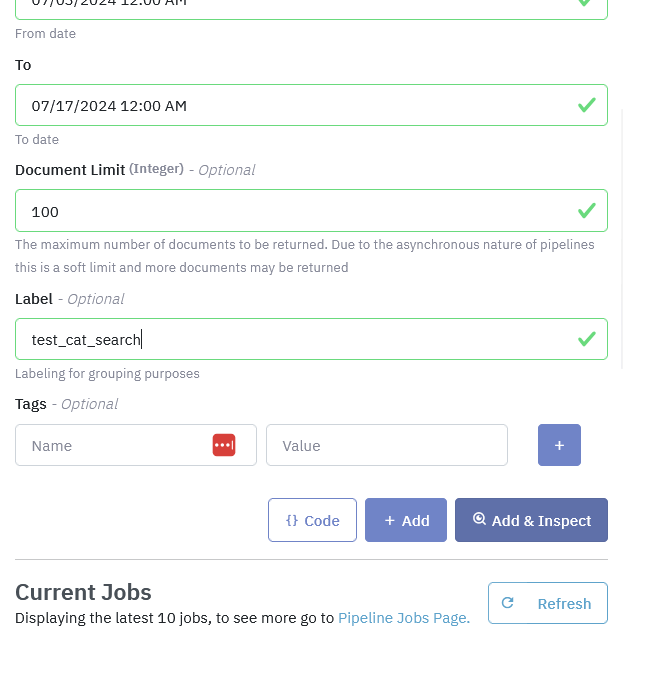
Add & Inspect
Additionally, adding an Inspector component to the pipeline unlocks the Add & Inspect button. This feature allows you to add a job and jump directly to the shared panel with auto-refresh enabled.
Auto-RefreshSince the time it takes for a document to be received by the Inspector varies depending on data source and pipeline steps, the Inspector will auto-refresh for up to 5 minutes before considering that no documents were found. You can still refresh manually after this timeout.
Alertings
You can use Document Inspector to set alerts around data volumes. Full documentation on this functionality is available here: Document Inspector Alerting
Updated about 1 month ago